Analytics Assessment
Overview
Ovative Group is an independent, digital-first media and measurement firm. Ovative Group helps change makers drive measurable performance. It is made up of a team of marketing experts who help clients push boundaries and think differently. Learn more about Ovative Group.
They gave us Digital Marketing & Analytics Intern Candidates an Analytics Assessment in order to determine if we made it to the first round of interviews.
The goal of this project was to give me a sense of the type of analyses they do, and it helped them understand my analytical capabilities.

April 2023
My Role
Digital Marketing & Analytics Intern Candidate, Digital Marketing Analyst, Data Analyst
Background
As an aspiring digital marketer, I was ready to get hands on experience to learn more and practice what I have learned. With this in mind, I decided to try and land an internship for the summer.
At Ovative, a digital marketing & analytics intern will perform heavy data analysis and help execute and manage media programs for our clients. Responsibilities included building, analyzing, and maintaining performance reports from suites such as Google Analytics and conducting research and producing/presenting client facing reports on technologies, competition, and market trends.

Luckily, my resume passed the first check, and I was selected to move forward in the application process. They sent me an Analytics Assessment to complete and upon its review, the Ovative team would reach out to me to extend an invitation for a first-round interview. The goal of this assessment was for me to get a sense of the type of analyses they do, and it helped them understand my analytical capabilities.
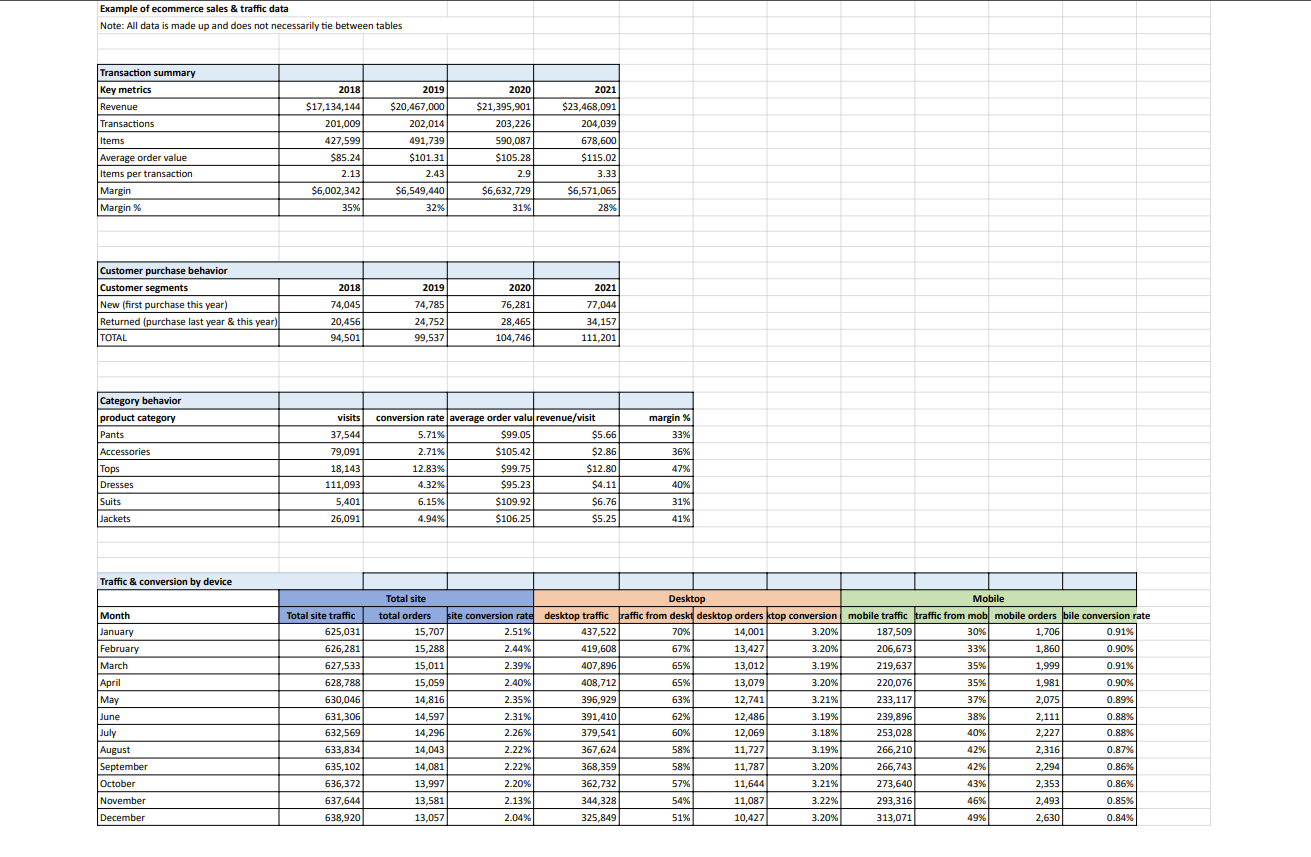
They presented me a spreadsheet and asked the following questions to be completed in 1-2 hours:
- What interesting trends have you noticed in the transaction summary table?
- Which year had the greatest revenue growth rate over the prior year?
- What was the percent increase for that year?
- If an advertiser delivered a 5:1 ROAS in 2021, what would be the ad cost (ad spend) be?
- What would their cost per order be based on that cost?
- In 2021, what percent of all customers were in the New segment in the customer purchase behavior table?
- Since 2018, which customer segment has experienced the greatest growth rate?
- How has the mix of customers in each segment trended since 2018?
- Based on product category performance, which particular category would you recommend we drive more traffic to in order to improve overall site & business performance and why?
- Overall site traffic growth has been flat but the conversion rate has been declining. Based on site metrics, which factor(s) are contributing to this decline in the site conversion rate and why?
Understanding the Problem
I had shown all of my work to get my answers and took down notes of which insights I had about the data.
- All key metrics have increased each year except for margin and margin %. Margin % has decreased each year.
- 2018-2019 had the greatest revenue growth rate over the prior year.
- 19.45% [revenue year 2/revenue year 1] ($20,467,000/$17,134,144 = 1.1945)
- $4,693,618.20 [revenue/5] ($23,397,901/5)
- $23.00 [cost/transactions] ($4,693,618.20/204039)
- 69.28& [x/total] (77,044/111,201)
- Returning customers
- Both groups have increased over each year. The returning customer segment has experienced the greatest growth rate.
- Tops, because they have the greatest margins.
- – Less people are using the desktop site and more are using the mobile site (looking at the traffic).
– Something is wrong with the mobile site though because even though more people are using the mobile site, the conversion rate is declining, so perhaps customers are having a bad experience on the mobile site.
– The declining mobile conversion rate is affecting the total site conversion rate negatively, since more traffic is going to the mobile site and leaving the desktop site.
Strategic Approach
Some insights and suggestions I had to make were:
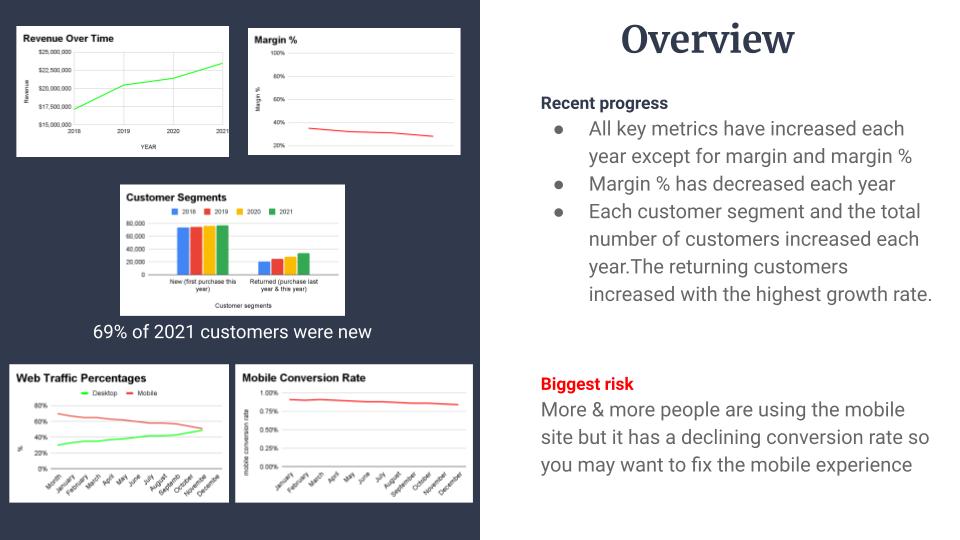
- All key metrics have increased each year except for margin and margin %. Margin % decreased each year. 2018-2019 had the highest growth rate over the prior year at 19.45%
- Both customer segment groups have increased each year, with the returning customer segment experiencing the greatest growth rate.
- A suggested category to focus on are tops since they have the greatest margins.
- A risk to fight against is allowing mobile conversions to keep declining. Less people are using the desktop site, and more are using the mobile site, by the looks at the traffic. Something is wrong with the mobile site because even though more people are using the mobile site, the conversion is declining, so perhaps customers are having a bad experience on the mobile. The declining mobile conversion rate is affecting the total site conversion rate negatively, since more traffic is going to the mobile site and leaving the desktop site.
Some strategies for my slide were:
- Turn some of insights I had above and use Excel charts to make it easier to explain.
- Only explain the important insights.
My Slide

Key Insights & Results
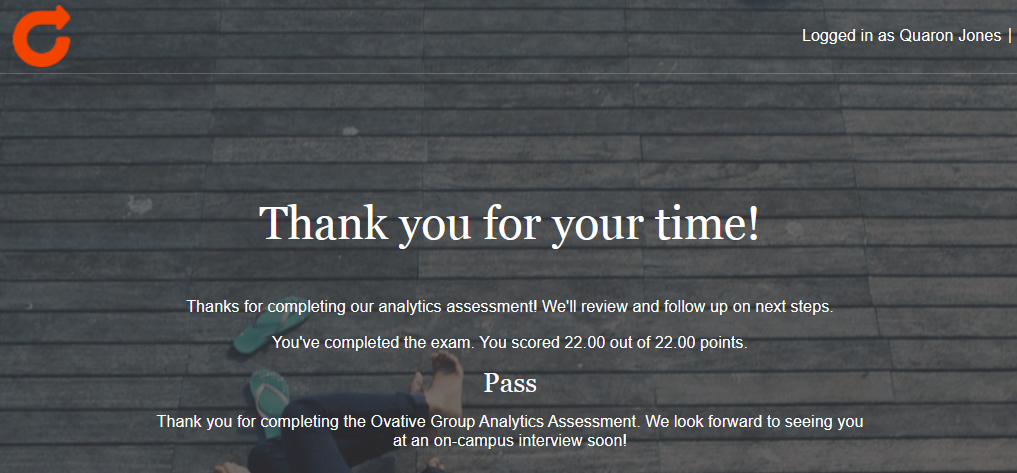
- Passed the assessment with a 22/22
- Earned an Interview with Ovative Group but declined due to me finding another internship.

Future Goals
- Get more efficient with creating graphics in Excel.
- Get better at making slide presentations.
